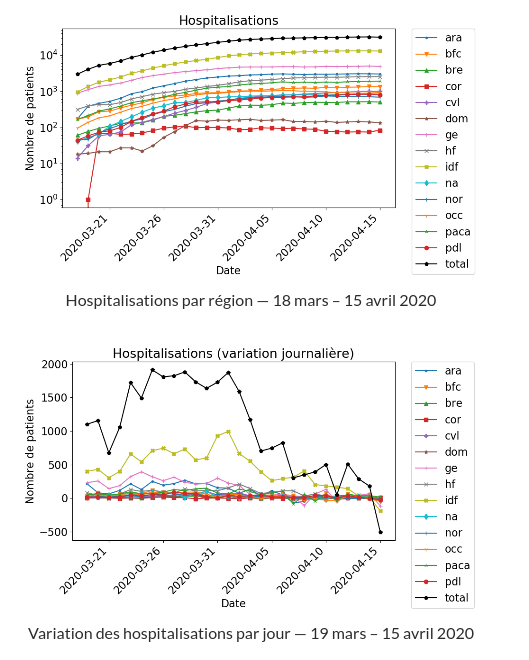
Données hospitalières relatives à l'épidémie de COVID-19 (SIVIC) SIVIC
Dans un contexte d’épidémie favorable, à compter du 1er juillet 2023, le cadre juridique actuellement en cours prévoit l’arrêt du traitement des données personnelles issues de SI-DEP. Par conséquent, après une période transitoire d’ajustement de deux semaines, les nouveaux indicateurs de…
Metadata quality:
Data description filled
Files documented
License filled
Update frequency not followed
File formats are open
Temporal coverage not set
Spatial coverage filled
All files are available
Updated on June 30, 2023
