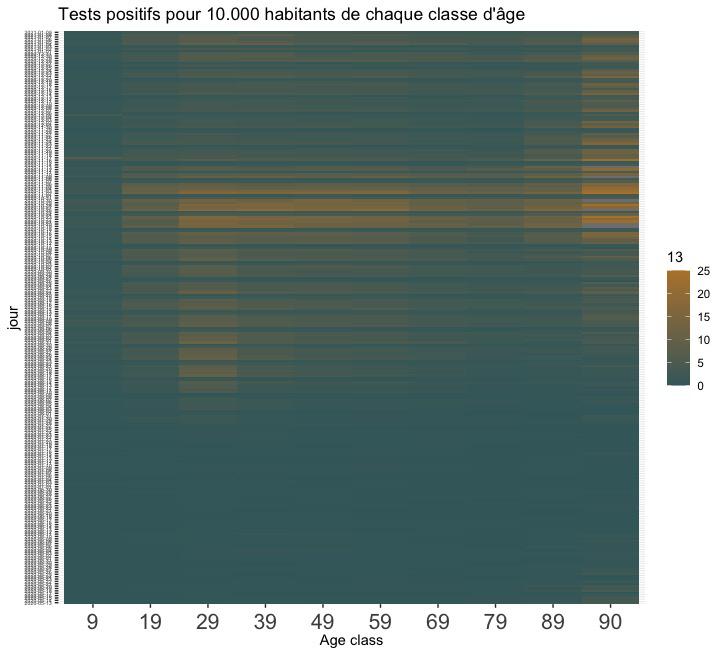
OLD Données relatives aux résultats des tests virologiques COVID-19 (SI-DEP) SI-DEP
⚠️ Cette ressource n'est plus actualisée depuis le 18 mai 2022. Le format des ressources issues des données de laboratoires pour le dépistage (SI-DEP) évolue. L'ensemble des ressources au nouveau format sont centralisées dans le nouveau jeu de données dédié : ➡️…
Metadata quality:
Data description filled
Files documented
License filled
Update frequency not followed
File formats are open
Temporal coverage not set
Spatial coverage filled
All files are available
Updated on May 18, 2022
