République
Française
Project Overview
This project examines the spatial distribution, concentration, and cumulative nature of industrial and environmental risks in the Gironde region. The analysis focuses on regulated industrial facilities (ICPE), pollutant-emitting installations (IREP), hazardous-material pipelines, and former industrial sites in order to identify zones of heightened environmental pressure.
Research Goals
The objectives of this research are to:
-
Identify and visualise clusters of industrial and environmental risk
-
Highlight communes with high concentrations of hazardous activities
-
Examine spatial relationships between industrial facilities and infrastructure
-
Assess whether higher facility density is associated with greater environmental discharges
Research Questions
The project addresses the following four research questions:
1. Spatial Distribution
How are industrial and environmental risk facilities (ICPE, IREP, and pipelines) distributed across the Gironde region?
2. Clustering and Proximity
Do pollutant-emitting facilities cluster spatially within existing industrial zones and infrastructure corridors?
3. Historical Overlap
Is there a spatial overlap between current pollutant-emitting sites and former industrial activity?
4. Risk Density and Discharges
Do communes with higher densities of ICPE and IREP facilities also report greater environmental discharges?
Research Data
This study relies exclusively on publicly available open-data sources related to industrial risk and environmental infrastructure in the Bordeaux–Gironde region.
Data Processing and Methods
The analysis includes:
-
Harmonisation of all spatial datasets to Lambert-93 (EPSG:2154)
-
Mapping of all industrial risk layers on a common spatial reference
-
Kernel Density Estimation (KDE) using a 1 km bandwidth to identify industrial hotspots
-
Aggregation of ICPE and IREP facility counts at the commune level
-
Comparison of facility density with total reported environmental discharges
Data Visualisation Overview
The results are presented through five complementary visualisations, each addressing a specific analytical dimension:
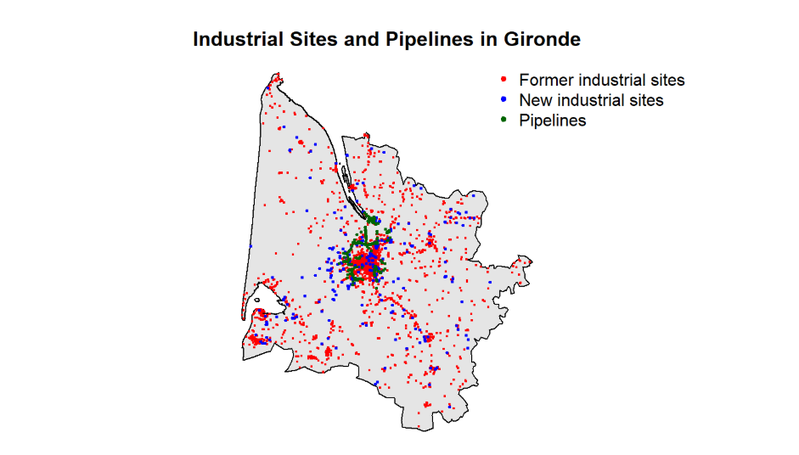
- Base Map of Industrial Risks
Displays ICPE facilities, pollutant-emitting installations, former industrial sites, and hazardous-material pipelines to illustrate the overall spatial distribution of risk sources. - Industrial Activity Hotspot Map
A kernel density map identifying areas of concentrated industrial activity based on the cumulative presence of risk-related installations. - Density versus Discharge Scatter Plot
Examines the relationship between ICPE + IREP facility density and total reported environmental discharges at the commune level. - Spatial Distribution of Industrial Risk Density
A choropleth map showing ICPE + IREP facility density per square kilometre by commune, highlighting spatial disparities in industrial concentration. - Cumulative Concentration of Environmental Discharges
A cumulative line graph illustrating how total environmental discharges accumulate across communes ranked by increasing industrial risk density.
Together, these visualisations provide both spatial and statistical perspectives on industrial risk and environmental pressure.
- Thématique
- Environnement et énergie
- Type
- Visualization
- Mots clés
- data-visualisationdatavisualisationdonnees-ouverteseigsiinspireodu-eigsirisque-zonages-risque-naturelvisualisationvisualisation-de-donnees
- Dernière mise à jour
- 21 décembre 2025
- Date de création
- 21 décembre 2025
Vues

Il n'y a pas encore de jeux de données associées