Global Top 10 Greenhouse Gaz Emitters
Visualization
Published on September 2, 2016 by Claire-Marie Foulquier-Gazagnes
This is a degraded experience of data.gouv.fr. Please enable JavaScript and use an up to date browser.
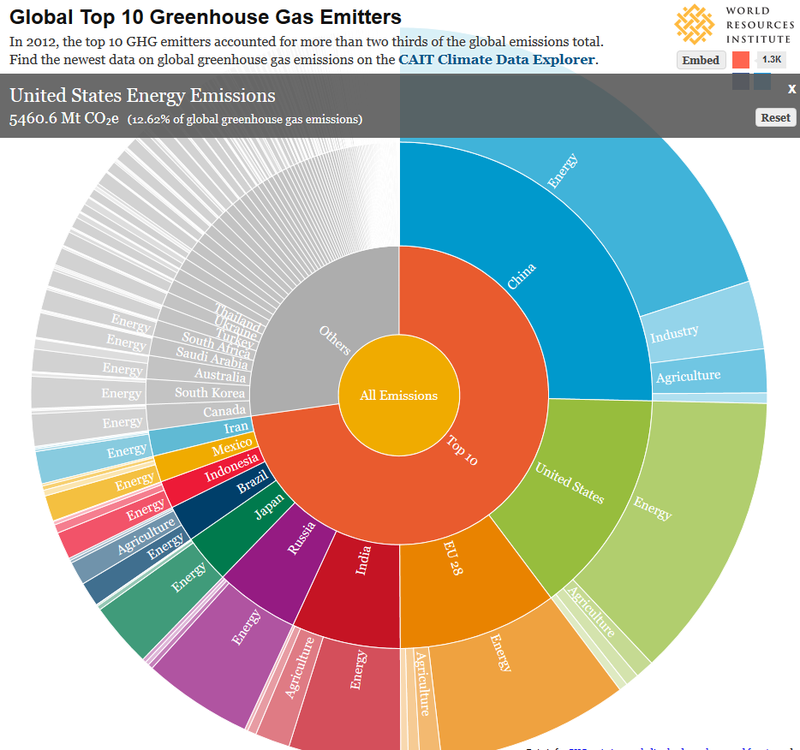
The CAIT Country GHG emissions collection applies a consistent methodology to create a six-gas, multi-sector, and internationally comparable data set for 186 countries.
CAIT enables data analysis by allowing users to quickly narrow down by year, gas, country/state, and sector. Automatic calculations for percent changes from prior year, per capita, and per GDP are also available. Users are presented with clear and customizable data visualizations that can be readily shared through unique URLs or embedded for further use online.
Data for Land-Use and Forestry indicator are provided by the Food and Agriculture Organization of the United Nations (FAO). WRI has been granted a non-exclusive, non-transferrable right to publish these data. Therefore, if users wish to republish this dataset in whole or in part, they should contact FAO directly at copyright@fao.org
Data sources:
August 31, 2016
Data description filled
Files documented
License filled
Update frequency not followed
File formats are open
Temporal coverage not set
Spatial coverage filled
All files are available
Update frequency not followed
Temporal coverage not set
Visualization
Published on September 2, 2016 by Claire-Marie Foulquier-Gazagnes
There are no community resources for this dataset yet.
57c6dff7c751df24c697bae5
August 31, 2016
Annual
August 31, 2016
Country
1.6k
135
1
0