République
Française
VisioMel database: predicting cutaneous melanoma relapse
Melanoma is a cancer arising from melanocytes—the pigment-producing cells located primarily in the skin, but also, less commonly, in mucosal membranes. While most cases occur in the skin, mucosal melanomas represent a rarer but clinically significant subset. The pathogenesis of cutaneous melanoma is multifactorial, involving a combination of environmental factors — particularly ultraviolet (UV) radiation — host-related characteristics, such as the presence of atypical nevi, a high total nevus count, and skin phototype, as well as inherited genetic susceptibility.
Although they represent only about 10% of all skin cancers, cutaneous melanoma are among the most aggressive forms of skin cancers, primarily due to their high metastatic potential, which critically worsens the prognosis. Metastatic dissemination occurs when malignant cells from the primary tumor invade surrounding tissues and establish secondary lesions in regional lymph nodes (referred to as loco-regional melanoma) or distant organs (distant metastases). Metastases are infrequently present at the time of initial diagnosis and generally emerge during disease monitoring or follow-up.
Diagnosis of melanoma involves microscopic analysis of tumor tissue by a pathologist. By examining a stained histological slide, the pathologist confirms the disease diagnosis and assesses lesion severity based on prognostic factors such as the tumor thickness or the presence of ulceration. Combining this analysis with clinical prognostic factors (such as age, sex, and medical history) enables dermatologists to adapt treatment to the disease's severity.
Patient survival in melanoma is highly dependent on the stage at diagnosis. In cases of primary cutaneous melanoma without metastatic spread, prognosis is strongly associated with tumor thickness. For example, early-stage melanomas measuring less than 1 mm in thickness have a 5-year survival rate exceeding 95%. In contrast, melanomas thicker than 4 mm are associated with a relapse risk of approximately 70 to 80% within five years, indicating a substantial risk of disease recurrence after initial treatment. In patients presenting with metastatic melanoma at diagnosis or experiencing relapse, treatment options may include surgical interventions — such as lymph node dissection or metastasectomy — as well as systemic therapies, including immunotherapy and targeted therapies.
Although thin melanomas (<1 mm) are generally associated with favorable outcomes, they still account for a non-negligible and poorly understood proportion of recurrences and melanoma-related mortality. Similarly, intermediate-thickness melanomas (1–4 mm), which carry a higher risk of recurrence, currently lack reliable biomarkers or clinical predictors of metastatic progression.
Adjuvant therapies are available to reduce the risk of relapse in selected high-risk, resectable melanomas. However, these treatments are associated with substantial financial costs and potentially severe toxicities. Therefore, there is a pressing need to identify patients who are unlikely to relapse in the absence of adjuvant therapy, in order to optimize treatment allocation and avoid unnecessary exposure to adverse effects. Furthermore, neoadjuvant immunotherapy strategies are rapidly expanding for melanomas at high risk of relapse.
The goal in this challenge was to predict the occurrence of a relapse within the 5 years following initial diagnosis using digitized versions of microscopic slides and tabular clinical features.
The creation of the VisioMel database was supervised by the French Society of Pathology along with the French Society of Dermatology, the Cutaneous Cancer Group (GCC) and the National Professional Council of Pathologists (CNPath) in collaboration with the Health Data Hub (HDH) as part of the Data Challenge program. The VisioMel challenge occurs from May to June 2023. During this challenge, participants had to predict a score between 0 and 1 indicating the likelihood of relapse for each slide.
Data challenges are global competitions aimed at solving specific problems within a given time frame using highly anonymized data. Thus, these challenges are intended for data scientists (researcher, industrials, students etc.) from all around the world. The goal in this challenge was to predict whether a relapse will occur in the 5 years following the initial diagnosis using digitized versions of microscopic slides and tabular clinical features. For each slide, participants had to predict a score between 0 and 1 indicating the likelihood of relapse.
Challenge participants generated over 600 submissions, and the winning solutions achieved log loss scores of 0.39-0.40 (lower is better) compared to 0.50 for a benchmark model that predicted relapse from tabular clinical features. In terms of area under the ROC curve, winning submissions substantially outperformed the benchmark with AUC scores surpassing 0.80.
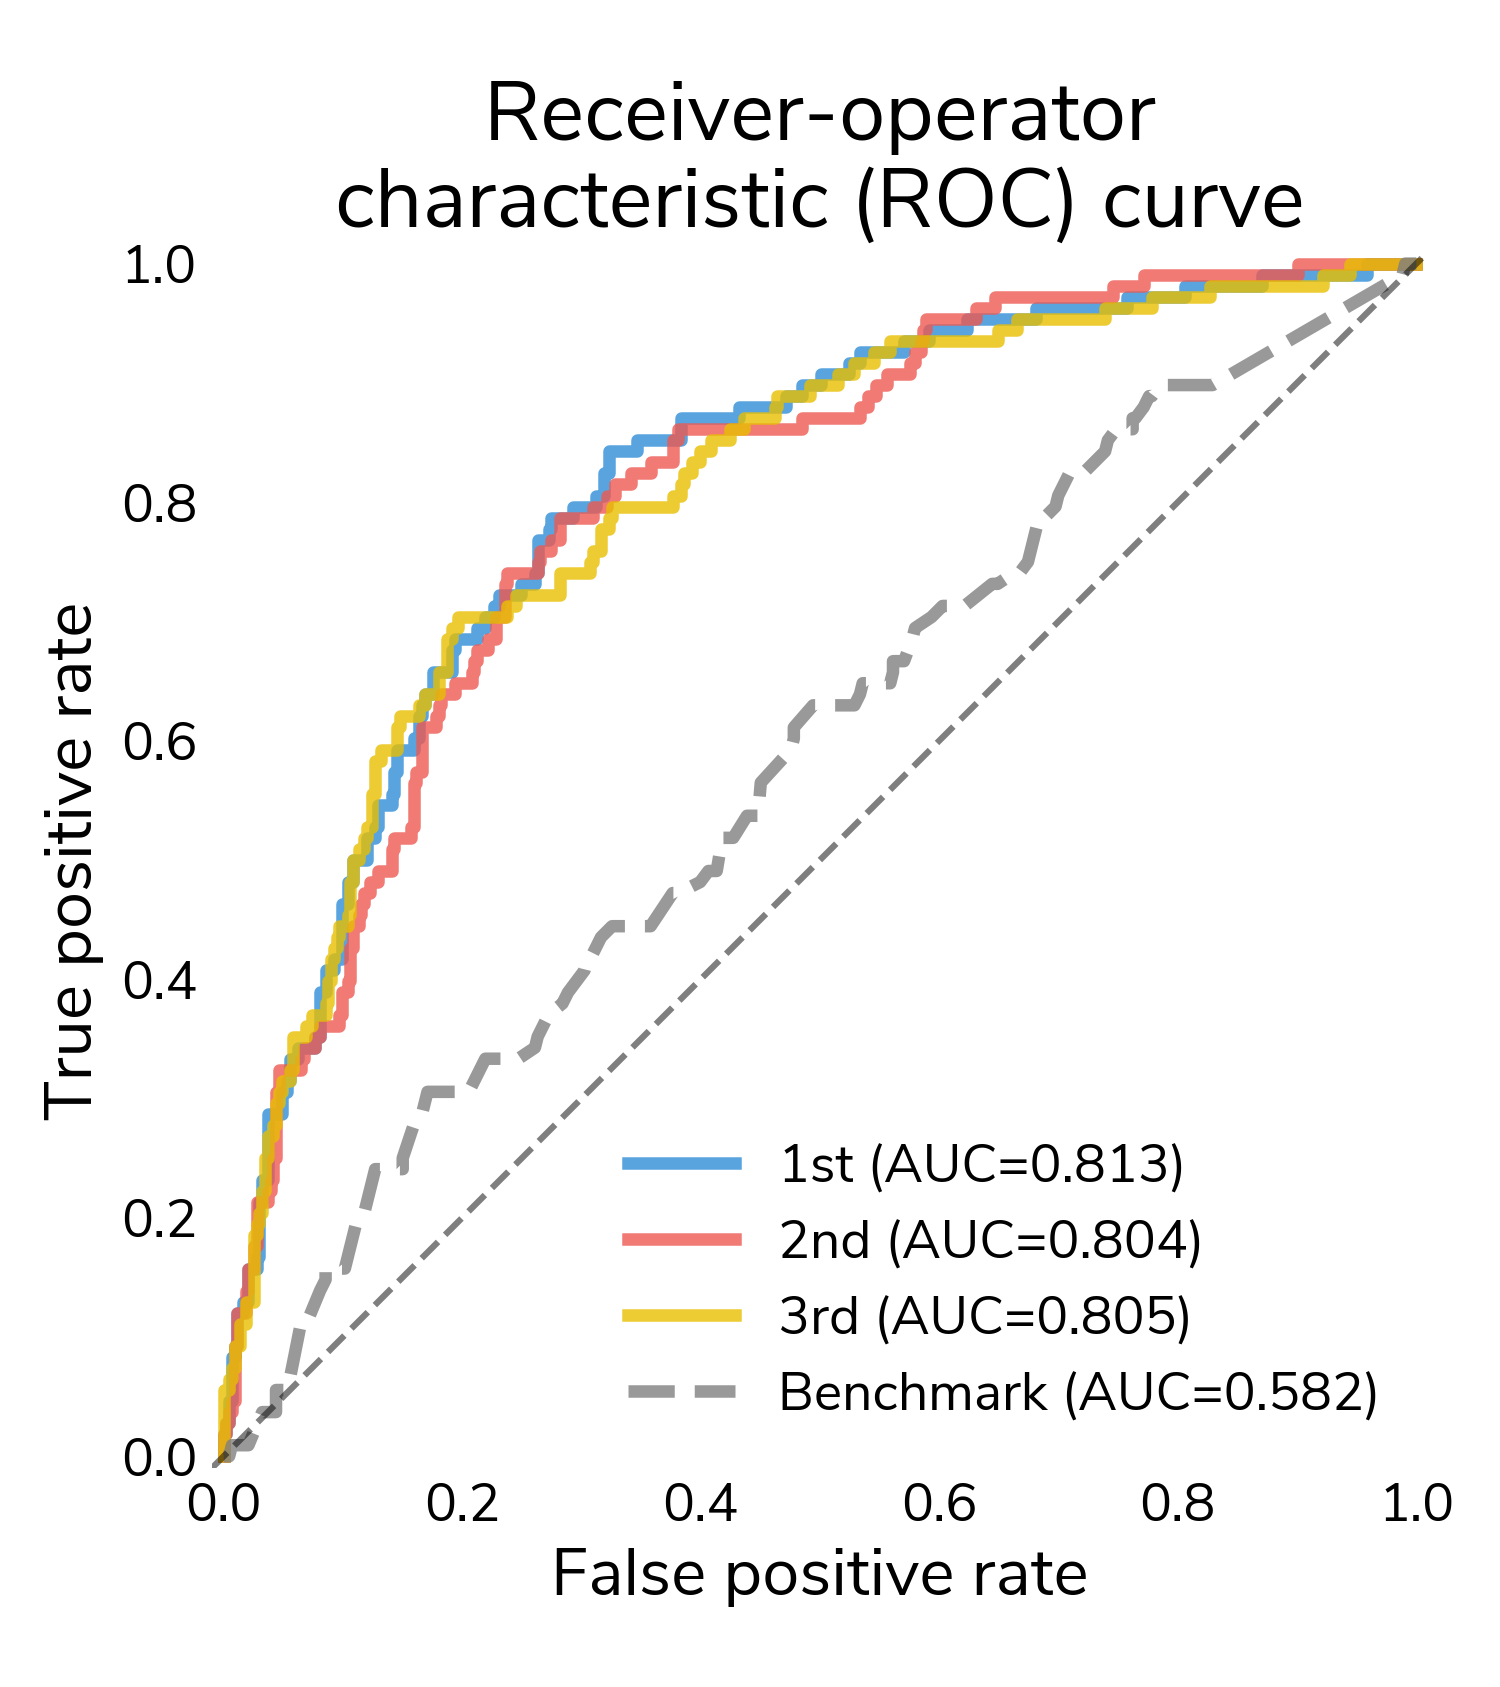 Figure 1. Area under the ROC curve of winning solutions.
The results suggest that computer vision can detect signals in whole slide images (WSIs) that help make more accurate predictions of relapse months to years into the future.
The confusion matrix shows the number of different types of successes and errors. The raw counts highlight the class imbalance in the data: there are far more "no relapse" cases than relapses.
To understand detection rates, we normalize the confusion matrix so that each cell shows the proportion of actual relapse/no relapse cases that were classified correctly/incorrectly. The bottom right cell (Actual: Yes / Predicted: Yes) shows the true positive rate or the proportion of relapses that were correctly detected. The top left cell (Actual: No / Predicted: No) shows the true negative rate or the proportion of "no relapse" cases that were correctly classified as no relapse. On average, solutions correctly detected around 73% of relapses in the test set and correctly identified around 75% of "no relapse" cases.
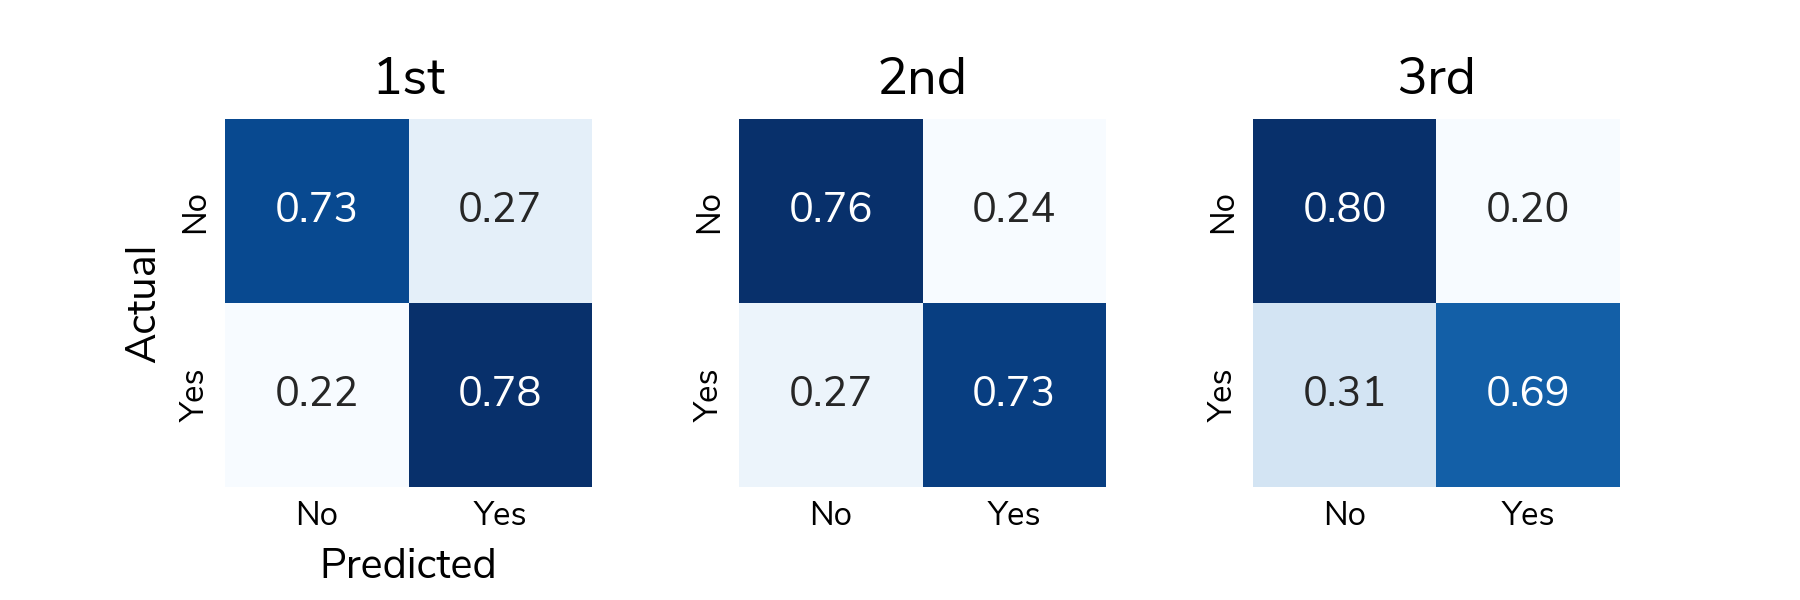 Figure 2. Confusion matrix associated with winning solutions.
All the prize-winning solutions from this competition are linked below and made available for anyone to use and learn from.
Patients selection was made from the RIC-Mel database. Thanks to the efforts of a network of physicians from 49 French inclusion centers, this national database created in 2012 now collects data from around 40,000 patients with melanoma.
Patients were selected according to the following criteria:
- Cancer stage between 0 and IIC,
- Initial diagnosis between 2012 and 2016
The data collection occurred in two main stages:
- Updating the clinical variables and patient care pathway, including the search for potential relapse by patient-inclusive centers (hospital centers or cancer care centers within the RIC-Mel network). This stage underwent validation through consistency checks.
- Unarchiving, de-identification, and digitization of histological slides corresponding to the excision of primary melanomas from these patients by pathology laboratories that diagnosed the melanoma.
Clinical data along with digitized histological slides from nearly 2,000 patients were collected, anonymized, and made available to competitors for 7 weeks on a dedicated competition platform.
Challenge data include whole slide images (digitized versions of microscopic slides) and clinical variables.
Whole slide images (WSIs) are digital formats that allow glass slides to be viewed, managed, shared, and analyzed. WSIs of melanomas are provided in the form of pyramidal TIFs, which are a multi-resolution, tiled format. These extremely high resolution images can be quite large. You can find more information and tips for working with the data on the data resources page.
Each patient is represented by one pyramidal TIF, which corresponds to one row in the metadata csv. The filename column is the unique identifier that connects the images to the metadata.
Alongside the WSIs, you are provided with a metadata file that contains clinical variables collected from the patient at the time of initial diagnosis. These include demographic factors (e.g., age and sex) as well as some variables related to the tumor (e.g., its location and thickness).
The clinical variables included in the VisioMel data challenge and their prognostic relevance are as follows :
- Breslow (tumor thickness in millimeters at diagnosis): one of the most important factors for predicting the risk of relapse. Thicker melanomas have a worse prognosis than thinner ones.
Type: string.
Categories: <1 ; [1 : 2[ ; [2 : 4[ ; >=4
Unit: millimeters. - Ulceration of the epidermis (total loss of epidermal tissue): the presence of ulceration is often associated with a poor prognosis. Indeed, ulcerated tumors tend to be more aggressive and present an increased risk of local or metastatic recurrence.
Type: string.
Categories: YES ; NO. - Age (age_at_initial_diagnosis): patient’s age may play a role in predicting relapse. Younger patients may sometimes have a slightly higher risk of relapse.
Type: string.
Categories: <20 years ; [20:30[ ; [30:40[ ; [40:50[ ; [50:60[ ; [60:70[ ; [70:80[ ; >80
Unit: year. - Sex: patient’s sex can influence the risk of relapse, although the impact may vary.
Type: string.
Categories: 1 ; 2 with 1 corresponding to male and 2 to female. - Tumor Location (melanoma_body_site): some anatomical sites may be more prone to relapse than others.
Type: string.
Categories: head/neck ; lower/upper limb ; trunk/pelvis. - Histological type of tumor: histological type influences the growth, clinical behavior, aggressiveness, and prognosis of melanomas.
Type: string.
Categories: ALM ; LMN/MLM ; NM ; SSM ; other/unclassified. - Family history of melanoma (melanoma_history): individuals with a family history of melanoma have an increased risk of developing the disease themselves.
Type: string.
Categories: YES ; NO with YES corresponding to the presence of family history of melanoma and NO corresponding to the absence of family history of melanoma. - Genetic Factors (BRAF_mutation): certain genetic mutations, such as those involved in the BRAF gene, have been linked to the risk of melanoma and relapse.
Type: string.
Categories: YES ; NO with YES corresponding to the presence of BRAF mutation and NO corresponding to the absence of BRAF mutation. - Patient status: whether the patient is alive or dead at the time of the cohorte conception (february 2023).
Type: string.
Categories: alive ; dead.
The labels for this dataset come from patients' medical records, and indicate whether the patient was diagnosed with a melanoma relapse in the 5 years after initial diagnosis:
- Locoregional relapse: recurrence or return of melanoma cancer cells in the nearby lymph nodes or tissues surrounding the original site of the primary tumor. This type of relapse indicates that the cancer has spread to the lymph nodes or tissues close to where it first developed, but has not yet metastasized to distant organs or parts of the body.
Type: string.
Categories: YES ; NO. - Delay between the initial diagnosis and the locoregional relapse (time_btw_initial_diagnosis_and_locoregional_relapse).
Type: integral.
Range: [0-96]
Unit: months. - Distant relapse: recurrence or reappearance of melanoma cancer cells in distant organs or parts of the body that are not near the site of the original tumor. This type of relapse indicates that the cancer has metastasized, spreading beyond the primary tumor site and nearby lymph nodes to other areas of the body, such as the lungs, liver, brain, or bones. Distant relapse is a significant progression of the disease and often carries a poorer prognosis compared to locoregional relapse or primary melanoma.
- Delay between the initial diagnosis and the distant relapse (time_btw_initial_diagnosis_and_distant_relapse).
Type: integral.
Range: [0-95]
Unit: months. - Global relapse: corresponds to the first event of relapse that occurs after diagnosis (either locoregional or distant).
- Delay between the initial diagnosis and the global relapse (time_btw_initial_diagnosis_and_global_relapse): either locoregional or distant.
Type: integral.
Range: [0-105]
Unit: months.
The database has been divided into 5 files based on the value of Breslow.
The limitations of this dataset lie in the fact that many data points are missing, particularly regarding the presence or absence of the BRAF mutation.
Additionally, the number of patients who have relapsed remains low, although it is close to real-world scenarios.
Project leader of VisioMel melanoma relapse challenge : allalaurie@gmail.com
Scientific responsible : fstaroz@ouestpathologie.fr
To help you understand how pathologists analyze a slide to predict relapse, we have provided 16 annotated slides on this page. The annotations show how clinical variables are measured and outline healthy tissue and lesions (but not necessarily all lesions present on a slide).
See the results announcement for more information on the winning approaches.
An algorithm to detect artifact in the images is available here.
All of the prize-winning solutions from this competition are available for anyone to continue to use and learn from in the Driven Data GitHub.
More information about melanoma analysis by pathologists, annotated slides and artifacts in images, tips and tricks, additional reading and research here.
- Using deep convolutional neural networks to identify and classify tumor-associated stroma in diagnostic breast biopsies
- Assessment of machine learning of breast pathology structures for automated differentiation of breast cancer and high-risk proliferative lesions
- Histologic tissue components provide major cues for machine learning-based prostate cancer detection and grading on prostatectomy specimens
- Assessment of machine learning detection of environmental enteropathy and celiac disease in children
Creative Commons Attribution (CC BY 3.0)
Licence Ouverte/Open Licence 2.0 (Etalab 2.0)
The purpose of the user form is to track who (in terms of individuals and institutions) is using the data and potentially for what purposes. This form is not restrictive in the sense that access requests will never be denied.
For any reuse of this database, use the DOI provided below:
- Producteur
- Contacts
- Frédéric Staroz(Contact)Laurie Alla(Contact)
- Licence
- Creative Commons Attribution
- Dernière mise à jour
- 29 septembre 2025

Vues
0
Téléchargements
0

Il n'y a pas encore de ressources communautaires pour ce jeu de données.