République
Française
udata 3 usage metrics explained
Usage metrics are basically download counts and views counts for various objects (datasets, resources...). In udata 3 we heavily refactored the way it works.
Current architecture
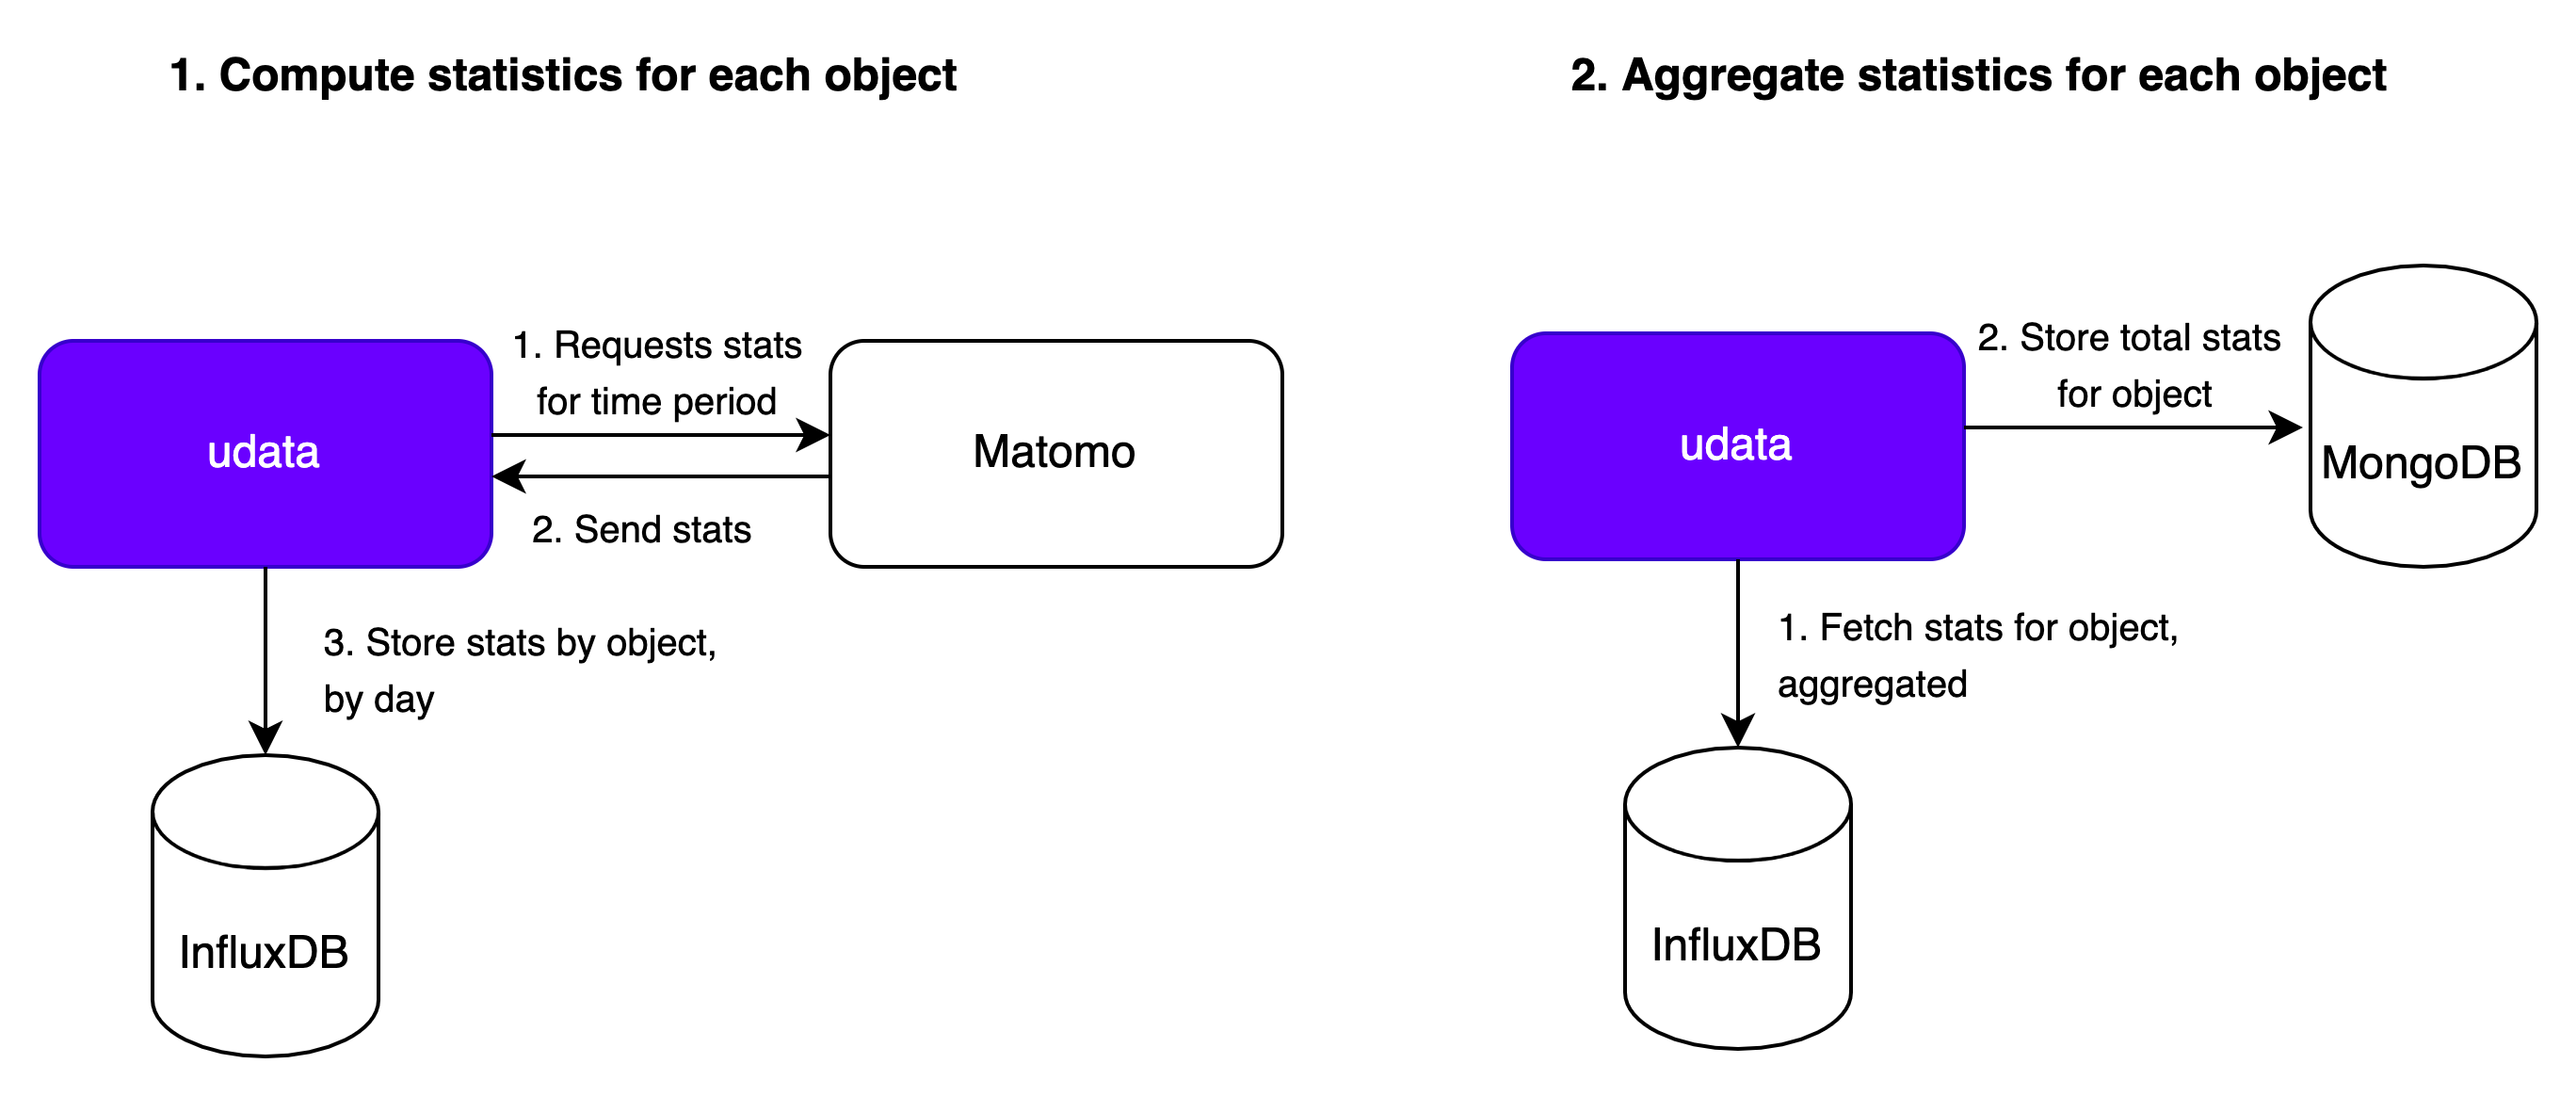
In udata 3, we introduced InfluxDB to act as an aggregator between Matomo (udata-piwik) and udata. This interface is handled by udata-metrics. The process is two stepped:
- udata periodically requests Matomo stats for a given time period for datasets, reuses, resources... ; tries to map it to database objects and then send a count for this time period to InfluxDB
- udata periodically requests InfluxDB for an aggregated stats count overtime for each object in the database and enriches the
metricsattributes with it
This refactoring allowed us to be more precise on our stats count, making the connection with Matomo less brittle and getting rid of the metrics collection that was growing huge in our database. Plus we got rid of some technical debt. We also had in mind to use the InfluxDB database for more features: time-based statistics on udata, external dashboard...
Unfortunately, it did not go quite as planned. We got bit by the release of InfluxDB v2 right after we launched with v1 in production, which would have forced us to rewrite most of our logic to migrate. We also did not take the time to leverage the capabilities of InfluxDB for more features. In the current state, InfluxDB is only used as an aggregator for Matomo stats, which is clearly overkill and still not very satisfactory in terms of stats precision, due to the sheer size of our Matomo instance.
Still, this is what is used in production at the time of writing.
Future
We're currently investigating other ways to gather some broader and more precise statistics. It will probably involve ingesting server logs (haproxy and/or nginx in our case).
Do It Yourself
Following our architecture principles, the metrics collection is actually pretty distinct from the way it's stored in udata. If you want to gather statistics from some other sources and compute them differently, all you have to do is fill the (dataset|resource|reuse|...).metrics dictionnary with your own value, like we do here for Matomo-through-InfluxDB values.